The ultimate sales tool for all business is all finally here on the android space. As tech savvy citizens of Generation Y, it is impossible to run a business that does not have its own website or some form of online presence for your brand. This is the most important part of your business online and it’s where you can make the maximum impact on a sustained basis. Now when this is the case, you are sure to keep a check of the number of people who are visit your site and tracking your website. This is exactly where Hubspot shines by offering its services as a business tool for managing your online website traffic and giving you key insights on where your marketing nails it and where it falls short.
 The prime objective of businesses is to ensure that traffic is coming and being generated to your website. Ahead of that, what is also needed is to ensure that the right kind of people are coming in. Extending the same logic further, it is imperative to know where these people are coming from, and in order to do that, you need to have the right tools to have solid, refined data that is aggregated through customer interactions that helps you paint the quintessential profile of your average customer.
Though majority of businesses are using Google Analytics today, Hubspot does the same and extends their services to help you generate leads and provide you with vital information for your business to succeed in the competitive market.
That being said, the Android app for Hubspot is all in lining with the branding of the main site.
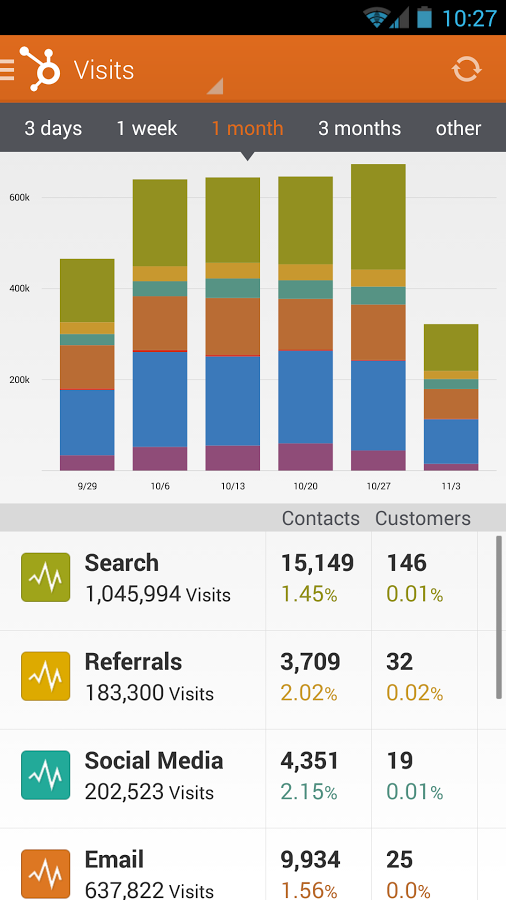
With orange and white being the predominant color schemes of its attractive interface, Hubspot allows you to see at the start the number of visits that your page generated over a pre-specified period of time.
This has to be mentioned by you and could be varying from:-
- Today.
- 3 days
- A week
- 1 month
- 3 months
- A year
- 3 years
- Other – Customizable period of time
Once you enter the period, you see a graph that is pretty colorfully designed to signify different elements. These parameters are:
- Search
- Referrals
- Social Media
- Email etc.
What you can also see is the bifurcation of the Contacts and the Customers. This is said to you in numbers and as a percentage of the total as well.
You can also see intra-monthly data where the line graph shows you how many total visits you generated.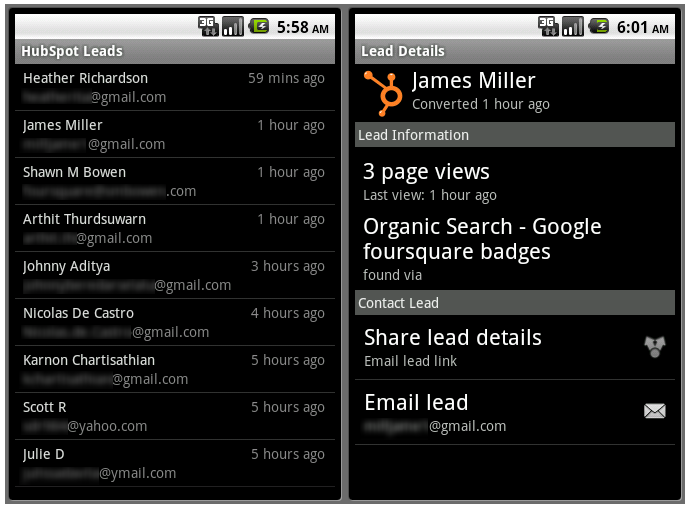
You can this compare this to last year/day/week/month and see the progress. The app shows you the total numbers, Increase from before and the percentage ahead.
You can also see what all has happened on the outside on Twitter with people @mentioning you to direct traffic to locations on your website.
You can also have access to a grader report that bifurcates the rank of the people who have come from different locations. These diverse avenues could be:-
- Blogging
- SEO
- Social Media
- Lead Generation
- Mobile
All of these specifics tell you where to focus all your attention on, and in the light of this, you can accordingly formulate strategies to expose and have the public to gain access to multiple locations of your site.
In the outside world, this app has been used to generate large scale revenue through analytics and now that it has made its way on the Android platform, you can easily use it for the same purpose for your mobile marketing needs.